In my previous post, I showed how to create the Excel template for a Dodeca relational view. In this post, I will complete the series by creating the SQLExcel view that will join together the SQLPassthroughDataset from part 1 and the Excel template from part 2 to display and summarize Essbase performance data.
To create the new, select the New button from the View Editor to see the New View dialog. I gave my view the ID and Name ‘Essbase Performance’ and chose the SQLExcel ViewType.
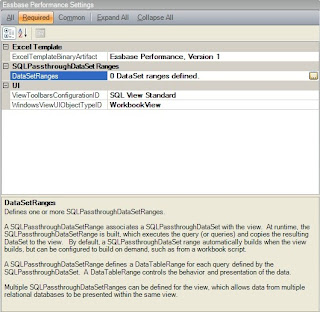
Once the view is created, the property set for the new view is displayed in the editor. There are four mandatory properties for this view type. The ExcelTemplateBinaryArtifact property is an object that wraps the Excel file that is used as the template for the view. The ViewToolbarsConfiguration and the WindowsViewUIObjectTypeID specify the set of toolbars to use for the view and the type of display window. The WorkbookView WindowsViewUI specifies the view to be rendered with a single workbook resized to the entire size of the view window.
The most important property, however, is the DataSetRanges property. The DataSetRanges property specifies the data to be retrieved along with the sorting, grouping and other display options.
The DataSet Range editor is used to specify one or more data set ranges that will be retrieved into the worksheet or workbook. In turn, each DataSet may contain one more DataTables. Each DataTable contains the data retrieved from a single SQL statement.
The DataTableRanges property is defined where each DataTable is placed on the worksheet.
This dialog dictates how and where the data is place into the worksheet. The key property is the DataSheetRangeProperty which defines where the rows returned in the DataTable are placed into the worksheet. Optionally, the data rows can exclude column headers and can insert cells into the range. This latter setting is very useful when you want to use Excel formulas in your group subtotal blocks as it is the key to having the spreadsheet engine automatically adjust the formulas. The GroupStartCell property specifies where Dodeca will start building the group blocks, if any. The groups are specified using the RowSortAndGroupByInfoList property. The editor for the RowSortAndGroupByInfoList specifies, obviously, how the rows are sorted and grouped.
The RowSortAndGroupByInfo Editor not only specifies the sorting and grouping of the data, but also specifies the Excel Outlining configuration and the range name used to identify the block. With these point and click configurations complete, here is what the completed view looks like.
The completed view shows metric information about the Essbase operations conducted through Dodeca. Essbase administrators have, over the years, tried to get this type of information by parsing the Essbase logs. Dodeca, however, provides a much simpler solution.
You Can’t Outrun Debt by Spending More!
2 months ago


No comments:
Post a Comment