Showing posts with label MDX. Show all posts

Thursday, January 11, 2018

Using MDX for Generated Members in Essbase Reports


There are times when Essbase users may need to see an ad-hoc collection of members aggregated together in Essbase, and that isn’t always an easy task.  If it were an aggregation that is needed on a recurring basis, the Essbase administrator may add an alternate hierarchy to assist.  Other times, users might just create a spreadsheet with the desired members in different rows or columns and use Excel formulas to add them together.  In this blog post, I will cover a third option, the use of MDX to create dynamically-generated members, how to run them in Smart View, and how to make them much easier to use in Dodeca.

In order to illustrate how dynamically-generated members can be used, let’s consider an example using the Sample Basic database.  Here is a simple quarterly income statement query that I will use as the basis for this blog post:

SELECT
    {[Year].Children, Year} on COLUMNS,
    Hierarchize(Descendants([Profit]), POST) ON ROWS
FROM 
    Sample.Basic
WHERE 
    ([Market].[New York], [Product].[Colas], Actual)

The results from this simple query look like this:


This MDX is pretty straightforward, but what if you wanted to see how New York and Connecticut would look if they were combined?  This is the question that a generated member can return for you.

Generated members in MDX are created using the WITH MEMBER clause.  Moreover, the generated member can then be used anywhere a normal member can be used, even in a slicer dimension (or what we would call a ‘page field’ in the classic Essbase add-in or a point-of-view in Smart View).  Here is the query modified to use the new generated member:

WITH MEMBER
    [Market].[SelectedMarkets] AS 'SUM({[New York], [Connecticut]})'
SELECT
    {[Year].Children, Year} on COLUMNS,
    Hierarchize(Descendants([Profit]), POST) ON ROWS
FROM
    Sample.Basic
WHERE
    ([Market].[SelectedMarkets], Colas, Actual)

The results from this query look like this:


So far, so good, but there are a couple of things to note.  First, the member displayed in the POV is not a real member; that is to be expected.  This leads to the second thing in that you cannot refresh the query as an ad-hoc analysis; the dynamically generated member name will be replaced with the dimension member name in its place.

To go even further, what if you want to have multiple generated members?  In that case, the syntax is easy as you just continue with another MEMBER clause:

WITH MEMBER
    [Market].[SelectedMarkets] AS 'SUM({[New York], [Connecticut]})'
MEMBER
  [Product].[SelectedProducts] AS 'SUM({[Colas], [Grape]})'
SELECT
    {[Year].Children, Year} on COLUMNS,
    Hierarchize(Descendants([Profit]), POST) ON ROWS
FROM
    Sample.Basic
WHERE
    ([Market].[SelectedMarkets], [Product].[SelectedProducts], Actual)

The results of this query look like this:


The syntax for creating and using generated members is not that difficult, but there are a couple of things that make it a bit more difficult than it should be for end users to use this approach.

First, any time end users start having to deal with scripts of any kind, the level of complexity goes up exponentially.  As one of my mentors used to say, “The difference between zero lines of code and one line of code is much greater than the difference between one line of code and a hundred lines of code”.  In other words, it is hard to get users to deal with code of any kind.

Second, once an end user has to ‘write a line of code’, or script in this case, then they assume the responsibility for it being correct.  As there are differing levels of comfort and skill among users, the risk of error goes up.

Finally, when users use a script like the one used in this example, they have to type in the correct member names or, again, risk error. Here is the new MDX dialog in Smart View 11.1.2.5.720 showing where users type in the MDX including the member names.


To make it much easier for end users, Dodeca does a couple of things.  First, Dodeca developers can configure reports to use MDX without the end user ever having to know that MDX is powering the report ‘under-the-covers’.  Further, Dodeca has flexible Point-of-View selectors that allow the end user to simply pick which members they want to use in the query.

Dodeca report developers use tokens as a sort of substitution variables in the script.  The tokens are replaced in the script at run-time by the members selected by end users.  Here is the same script with tokens in place of the hard-coded values:

WITH MEMBER
  [Market].[SelectedMarkets] AS 'SUM({[T.Market]})'
MEMBER
    [Product].[SelectedProducts] AS 'SUM({[T.Product]})' 
SELECT
    {[Year].Children, Year} on COLUMNS,
    Hierarchize(Descendants([Profit]), POST) ON ROWS
FROM
    Sample.Basic
WHERE
    ([Market].[SelectedMarkets], [Product].[SelectedProducts], Actual)

The Dodeca Essbase Scripts editor has tools to help the report developer create and test MDX scripts.  Here are the Test Tokens available in the editor that allow developers to simulate the values plugged in by the Point-of-View selectors:


And the script itself in the scripts editor which has built-in testing facilities:


Finally, here is a Dodeca view that utilizes the tokenized MDX query and allows users to easily select the members they want dynamically aggregated and the report is produced without the risk of error.


Let me know if you would like to learn more about Dodeca and how it could help your company.


Wednesday, August 17, 2016

Cool Essbase MDX Stuff – Dimension Properties Edition

I have always liked MDX as it exposes very powerful operations for creating member sets.  It has this amazing ability to take a set of members, union it with another set of members, intersect it with yet another set of members, and then exclude members from yet another set.  This is very powerful.

Recently, I was talking with a customer about some creative uses for MDX and they told me about some cool things they had done with MDX.  Kudos to George Cooper and Esam Jaber at Gap for showing me some creative MDX.  Though this is a really cool and new-to-me technique, after doing some online searches I found that the technique isn’t new to everyone.  Both Gary Crisci and Harry Gates have blogged on it already at http://garycris.blogspot.com/2014/03/mdx-queries-to-get-parentchild-and.html and http://www.cubesavvy.com/cubesavvy-utilities-updated-mdx-capabilities, respectively.

This technique, which gives developers access to outline information that was not previously available, also seems to be lightning fast.  I decided maybe I need to write on it as well and, of course, put my own spin on it by showing how we can use this in the Dodeca Spreadsheet Management System.

So, what is it?  They are called dimension properties and can utilize the PROPERTY_EXPR function.  This function provides the ability to query for, and return, members related to a given member.  The ability to return related members, on the same row, is something that is unique to the Essbase query languages.  The Grid API, or query-by-example and used to retrieve data from Essbase in the classic add-in, Smart View, and Dodeca, cannot do it out of the box.  The Essbase Report Script language, which is frequently used for exporting data, cannot do it either.  Regardless, we have customers who have asked to how have the parent member and/or the grandparent member on the same row as a member.   In the remainder of this blog post, I will explain dimension properties, and more specifically, the PROPERTY_EXPR function.

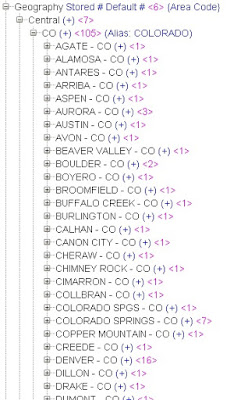
For this post, I will use the Geography dimension of the ASOSamp.Sample database.  The Geography dimension features members from different regions of the United States including details of the Region, the State, the City, and the Postal Code.  Here is a screenshot of some members in the Geography dimension:

Geography dimension members

With this dimension, let’s suppose you would like to get outline information at the city level, or level 1 in Essbase-speak.  In addition, let’s say you would like to have the state and the region as well.   Finally, while we are at it, maybe you also want to know the generation number of the member.  With dimension properties and the PROPERTY_EXPR function, you can get all of that information in one trip to the server.  Here is the query:

Select {} on COLUMNS,
Hierarchize(Descendants(Geography, Geography.Levels(1), SELF_AND_BEFORE), POST)
DIMENSION PROPERTIES
 GEN_NUMBER,
  PROPERTY_EXPR(Geography, MEMBER_NAME, Ancestor(CurrentAxisMember(), Geography.Generations(2)),"Gen2"),
  PROPERTY_EXPR(Geography, MEMBER_NAME, Ancestor(CurrentAxisMember(), Geography.Generations(3)),"Gen3")
 ON ROWS
FROM ASOSamp.Sample

Let’s break down the query to examine the components.  First, the Column axis specification is simple:

Select {} on COLUMNS,

The Column axis specification contains an empty set, but why do you need to even specify a set at all?  The Essbase MDX specification states that a query cannot skip axes based on a set order.  It seems much more natural for me to get data back on the second axis, or the Row axis, and as the Column axis is the first specified axis, a query cannot skip the Column axis and specify a Row axis.  As we really aren’t looking for any data to be returned in this query, then we can just use an empty set.

Next, let’s look at the Row axis specification:

Hierarchize(Descendants(Geography, Geography.Levels(1), SELF_AND_BEFORE), POST)

Let’s split this into sections starting from the inside out.  The Descendants function returns, naturally, all of the descendants of a given member down to, and including, level 1 members in the outline.  For this database, this query will return the Geography dimension down to the City level, but will not return the bottom, or zip code, level.

The member set returned by the Descendants function is then sorted by the Hierarchize function.

Hierarchize(Descendants(Geography, Geography.Levels(1), SELF_AND_BEFORE), POST)

The POST argument specifies that child members are sorted before their parent as they are in the spreadsheet add-ins.

Next, the DIMENSION PROPERTIES modifier for the Row axis specification provides the ability to return additional outline information related to each member returned in the set.  The DIMENSION PROPERTIES specify that the generation number, the related generation 2 and generation 3 members are returned for each member in the set.

DIMENSION PROPERTIES
 GEN_NUMBER,
  PROPERTY_EXPR(Geography, MEMBER_NAME, Ancestor(CurrentAxisMember(), Geography.Generations(2)),"Gen2"),
  PROPERTY_EXPR(Geography, MEMBER_NAME, Ancestor(CurrentAxisMember(), Geography.Generations(3)),"Gen3")

The GEN_NUMBER argument is self-explanatory, so let’s look at the PROPERTY_EXPR function to see how it works.  Consider this portion of the statement:

PROPERTY_EXPR(Geography, MEMBER_NAME, Ancestor(CurrentAxisMember(), Geography.Generations(2)),"Gen2")

The first argument is the dimension name, so that is easy enough.

The second argument, called the property_name argument, has a number of valid values as documented by Oracle in the documentation.  Valid values are MEMBER_NAME, MEMBER_ALIAS, LEVEL_NUMBER, GEN_NUMBER, IS_EXPENSE, COMMENTS, RELATIONAL_DESCENDANTS, MEMBER_UNIQUE_NAME), an attribute dimension name, an alias-table name, or a UDA.  At the time of this writing, the current docs are located at http://docs.oracle.com/cd/E26232_01/doc.11122/esb_tech_ref/frameset.htm?mdx_property_expressions.html.

The third argument is called member_value_expression and this is where the magic happens.  In this argument, you can use a number of functions that return exactly one member that is related to the current member.  In my example above, the Ancestor function is being used to return, for each member in the set as specified by the CurrentAxisMember function, the ancestor of that member at a given generation.  Among other functions are functions that allow you to get the parent, first child, next sibling, or previous sibling of the current member.

The fourth and final argument is used to give a title to the column containing the extended information.

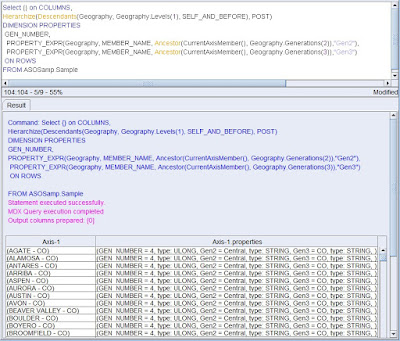
So, now that we know a bit about this syntax, what does it look like in EAS?  

MDX dimension properties in EAS
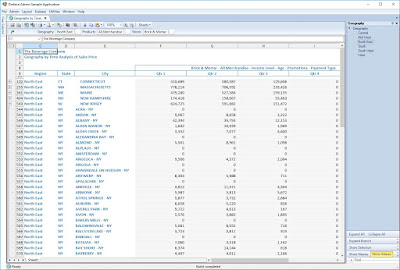
In their blogs, both Gary and Harry talk about ways to actually consume this information.  Harry wrote a special interface to display dimension properties returned by MDX.  Gary talked about the idea of using an Excel macro to parse the output.  I had my own ideas on how to use dimension properties in Dodeca.  I setup a simple Dodeca report and used a only 3 lines of our automation language, workbook scripting, to build the view.  Here is screenshot of my simple Dodeca view.

Dynamic MDX View in Dodeca
While running this view in Dodeca, the user can filter based on Geography, Product, and Stores dimensions and the report is highly dynamic.  The automation in Dodeca performs these tasks:
  1. Returns members and properties as the descendants of a user-selected Geography member
  2. Retrieves and places the dimension properties and the members on the worksheet
  3. Places the selected Product and Stores dimension members in the proper location
  4. Retrieves Essbase data into the worksheet
  5. Creates Excel grouping based on the generation number
I will leave the step-by-step of creating this view in Dodeca to another blog post.

So, how could you use dimension properties?